

Exercise intensity is an essential training variable. Modifying it helps prevent overtraining and also ensures you’re working hard enough.
Absolute and relative exercise intensity are often confused. But once you get them straight and apply them correctly to your workouts, your results will take off like a Superman leaping to Louis Lane’s rescue.
Absolute Exercise Intensity
Absolute intensity is the amount of weight based off your 1RM. It is expressed as a percent of your 1RM.
So an absolute intensity of 80% means that you are lifting 80% of the weight that you can lift for one rep.
Absolute intensity is always based off your 1RM.
Relative Exercise Intensity
Relative intensity refers to the amount of weight used based on your max at that specific rep scheme.
Relative intensity needs two numbers:
- Your max weight for a specific rep. [For example… What’s the maximum amount of weight you can lift for 10 reps.]
- The intensity or how close to failure your want to go. [Usually expressed as a percentage]
The intensity at a specific rep range is your Relative Exercise Intensity.
Absolute Intensity and Relative Intensity Table
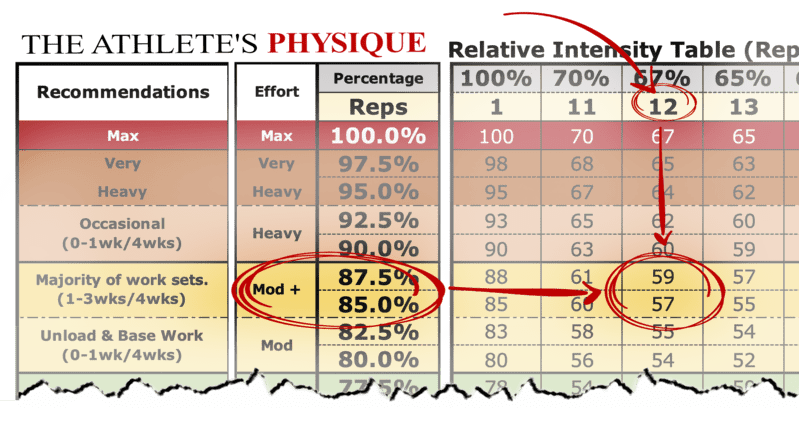
The Relative Intensity Tables below tell you how much weight to use to reach a specific intensity based on a percentage. A little math is needed. But stick with me. It’s easy. The Intensity Table makes it so simple.

The Exercise Intensity 1RM Table above is for reps 11-20. Downloadable Relative Intensity Tables are at the bottom of the page.
To make this clear, let’s look at an example.
Imagine that we’re working together. Your bench press 1RM is 315 pounds and you’re on a tough macro-cycle this week working at a moderate plus intensity hitting 12 reps.
Looking at the table above you see that the yellow blocks contain your moderate intensity values.

Relative intensity of 85 – 87.5%
Looking at the Exercise Relative Intensity column we see that working in the moderate plus block has a Relative intensity of 85 – 87.5%.
Then, looking to the right on the Intensity Table move over until you’re in the the 12 rep column. It says that the absolute intensity is 57-59%.
So, for your set of 12 you’ll use 180 – 185 pounds.
Here’s the math behind it…
The Relative Intensity and Absolute Intensity Math:
- Relative Intensity
- If you know your 12RM, use relative intensity. (In this case it’s 211 and the relative intensity for a moderate plus set is 85-87.5%)
- 211 x 87.5% = 184.6 (185)
- 211 x 85% = 179.35 (180)
- If you know your 12RM, use relative intensity. (In this case it’s 211 and the relative intensity for a moderate plus set is 85-87.5%)
- Absolute Intensity
- If you don’t know your 12RM but know your 1RM it’s easier to use absolute intensity. (For this example you 1RM is 315 and the absolute intensity range for a moderate plus set is between 57% and 59%)
- 315 x 59% = 185.85 (186)
- 315 x 57% = 179.55 (180)
- If you don’t know your 12RM but know your 1RM it’s easier to use absolute intensity. (For this example you 1RM is 315 and the absolute intensity range for a moderate plus set is between 57% and 59%)
The RI Table above is for reps 11-20. Downloadable Following reps and effort give absolute intensity.
Chances are that you’re not using fractional weights so your weight gets rounded to nearest 5 pound increment. So, for an appropriate Exercise Intensity use between 180 and 185 pounds.
Note: Use the 1RM Table to easily find your 1RM or your rep max.
For this example you the 300-400 pound 1RM table to find your rep maxes.
I use relative intensity to plan workouts and absolute intensity to do my weight calculations.
Here’s a good video explaining how to use relative and absolute intensity in a strength portion of your workout…
Max Strength Programming Using Relative and Absolute Intensity
This table works well along side the RPE scale.
Using 1RM to Max Table
This one rep max table is a handy reference.
It tells you what percentage of your 1RM you’e working at a given rep. Or how many reps you can expect at a specific percentage of your 1RM.
Since everyone is built just a little different the relationship between 1RM and number of reps at a given percentage don’t align perfectly.
The standard formula is 3% per rep. A 2 RM is 97% of a 1RM. A 5 RM is 88% of your 1 RM. But the NSCA had done lots of research and found a slightly different relationship. So I included their reps to 1RN to percentage values.

Click 1RM Table for large version. One rep max table show what percentage of 1RM you can hit for specific number of reps.
One Rep Max (1RM) Calculator
Results:
Relative And Absolute Intensity Tables
Download
(and print out)
- Click here for reps between 1and 10.
- Click here for reps from 11-20.
Putting It All Together
Absolute and relative intensity are two of the most useful tools in your training arsenal. But only if you know how to use them.
Absolute intensity tells you what percentage of your 1RM you’re lifting. If you know your 1 rep max, this makes it the easiest way to calculate your training weight. Relative intensity takes it a step further. It factors in how close to failure you are at a specific rep range, giving you a more precise target for each set.
The key takeaway…
use relative intensity to plan your workouts and absolute intensity to calculate your weights. Pair both with the RPE scale to gauge effort in real time, and you’ll always know exactly how heavy to go, no guessing required.
Once you’re comfortable reading the intensity tables, programming your workouts becomes straightforward. Pick your goal, choose your intensity level, find your weight, and get to work. That’s it.
1RM Estimation Tables
Printable one rep max chart (1RM Table) for maxes between 0 and 100.

Printable one rep max chart (1RM Table) for maxes between 100 and 200.

Printable one rep max chart (1RM Table) for maxes between 200 and 300.
Printable one rep max chart (1RM Table) for maxes between 200 and 300.
Printable one rep max chart (1RM Table) for maxes between 400 and 500.

Printable one rep max chart (1RM Table) for maxes between 500 and 600.
Related Guides
- 1RM Calculator: How to Find Your One-Rep Max —
Find your one-rep max using rep-max tests and estimation tables. Your 1RM is the foundation for all intensity calculations. - What Is RPE? How to Use the Rate of Perceived Exertion Scale —
Learn how to use RPE alongside intensity tables to gauge how close to failure you are during training. - 1RM Table: Maxes Up to 100 —
Printable one-rep max chart for lifts with a max between 0 and 100 lbs. - 1RM Table: Maxes 100–200 —
Printable one-rep max chart for lifts with a max between 100 and 200 lbs. - 1RM Table: Maxes 200–300 —
Printable one-rep max chart for lifts with a max between 200 and 300 lbs. - 1RM Table: Maxes 300–400 —
Printable one-rep max chart for lifts with a max between 300 and 400 lbs.
Cover photo by Anastase Maragos from Unsplash